Luma Knowledge Dashboard provides Key Performance Metrics in Artifacts Usage, Money, and the value that brings to the organization. It enables a system administrator to view the key metrics related to Artifacts retrieval, User Request Insights, and Channel performance inLuma Knowledge. This DashBoard is beneficial in many ways, and empowers Management, Curators to get real-time data on the system performance and effectiveness.
...
Feedback is the information gathered by the system directly from the end-users or based on users' user’s interaction with the system. It is used to derive the effectiveness and usefulness of the content available in the system.
...
It is defined as the percentage of user searches with positive feedback (Helpful) divided by the total feedback received ( i.e. both positive and negative).user inquiries.
For example,
Total number of user inquires = 50
...
Positivity Rate = 62.5% 50% calculated as (25/(4050)) *100
| Info |
|---|
An inquiry with both positive and negative feedback for Artifacts returned is considered as Inquiry with positive feedback. |
...
AQI = 75% calculated as (45/(45+15)) *100
Artifact Volume
User Queries
User sessions queries represent the total number of User inquiries or Searches in Luma Knowledge that may or may not lead to retrieval of Knowledge Artifacts or FAQs. It is basically the number of end-user inquiries in a specific period of time.
...
Views represent the number of artifacts accessed or viewed by the user.
User Request Insights
The KPI Parameters in this section are derived from the type of User Inquiries and Feedback.
Hot Spots
Hot spots are the Most frequently viewed artifacts. Here, an Administrator can view the list of artifacts with the highest request volume.
...
Below details are available for each artifact in the list:
...
Domain: The Domain to which artifact belongs to
...
Topic: The main topic of the artifact
...
Type: The type of artifact (Article/FAQ)
...
Title: The title of the artifact
...
Catalog Volume
Catalog Queries
Catalog Queries represent the total number of User inquiries or Searches in Luma Knowledge that may or may not lead to the retrieval of catalogs. It is basically the number of end-user inquiries in a specific period of time.
Catalog Returned
This is the number of catalogs returned as responses to user queries in the indicated time period.
Views
Views represent the number of catalogs accessed or viewed by the user.
User Request Insights
The KPI Parameters in this section are derived from the type of User Inquiries and Feedback.
Hot Spots
Hot spots are the Most frequently viewed artifacts. Here, an Administrator can view the list of artifacts with the highest request volume.
...
Below details are available for each artifact in the list:
Domain: The Domain to which artifact belongs to
Topic: The main topic of the artifact
Type: The type of artifact (Article/FAQ)
Title: The title of the artifact
ROI: The Return on investment obtained due to the artifact
Total Requests: Percentage of requests for the artifact versus total requests in the Tenant
AQI: The Artifact Quality Index (AQI) of the artifact. It indicates how effective an artifact is in solving a user’s inquiry.
...
For more information on updating the artifact or deleting the artifact refer to Knowledge Store
...
Knowledge Gap
Retrieval Accuracy
This section lists the Knowledge Gaps recorded indicates Observed Accuracy for your Tenant. These are searches or user Inquiries for which Knowledge/Artifacts are not available in Luma Knowledge. If User Inquiry does not return a Result, the system considers ‘No result’ as feedback on content available in the system. This implicit feedback is used to derive the metrics.
Based on this information, the Curator and Administrators can identify opportunities to create Artifacts and build knowledge.
| Info |
|---|
|
...
Retrieval Accuracy
This section indicates Observed Accuracy for your Tenant. It is the empirical accuracy seen through the actual use of Knowledge. It is a graphical representation of the accuracy of the retrieval over time. It does not represent the quality of the artifact’s contents or its usefulness.
It is calculated as the percentage of user inquiries with artifacts views by the total number of artifacts viewed.
For example,
Total number of user inquires = 50
Total artifacts returned = 60
Number of Artifacts viewed = 40
Number of inquired where artifacts were viewed =30
Retrieval Accuracy = 75% calculated as (30/40) *100
...
The Retrieval Accuracy for your tenant should improve with time. A declining accuracy may mean that user queries return more results. The curator must review the available Knowledge and update the metadata.
Volume v/s AQI
This is a graphical representation of Volume versus Artifact AQI for the specific time period. It indicates the total number of user inquiries against the quality of artifacts returned for the user inquiries. It is derived from User feedback.
...
AQI and Volume should be consensus with each other. In case of a declining AQI, the curator should encourage the end-users to provide more feedback on Artifacts and review the Artifact content and metadata periodically to improve the overall quality of Knowledge in the system.
Channels Performance
Return on Investment
This is a representation of the Return of investment for a channel on deploying Luma Knowledge in the organization. It is derived based on the User inquiries that were resolved through Knowledge available in the system.
Channel here represents the mediums or systems through which Knowledge can be accessed such as Luma Virtual Agent, Luma Knowledge Search Widget.
...
Feedback Response Rate
The Feedback response rate chart represents the percentage of feedback received on artifacts against the Target feedback rate (configurable) set for the channel.
| Info |
|---|
Feedback is critical in improving successful searches and effective artifacts. It enables the curator to keep knowledge in the system up to date and useful. |
...
Volume and Accuracy
This chart represents the total volume of user sessions against the Observed accuracy by channel. Here, It is the empirical accuracy seen through the actual use of Knowledge. It is a graphical representation of the accuracy of the retrieval over time. It does not represent the quality of the artifact’s contents or its usefulness.
It is calculated as the percentage of user inquiries with artifacts views by the total number of artifacts viewed.
For example,
Total number of user inquires = 50
Total artifacts returned = 60
Number of Artifacts viewed = 40
Number of inquired where artifacts were viewed =30
Retrieval Accuracy = 75% calculated as (30/40) *100
...
The Retrieval Accuracy for your tenant should improve with time. A declining accuracy may mean that user queries return more results. The curator must review the available Knowledge and update the metadata.
Volume v/s AQI
This is a graphical representation of Volume versus Artifact AQI for the specific time period. It indicates the total number of user inquiries against the quality of artifacts returned for the user inquiries. It is derived from User feedback.
...
AQI and Volume should be consensus with each other. In case of a declining AQI, the curator should encourage the end-users to provide more feedback on Artifacts and review the Artifact content and metadata periodically to improve the overall quality of Knowledge in the system.
Channels Performance
Return on Investment
This is a representation of the Return of investment for a channel on deploying Luma Knowledge in the organization. It is derived based on the User inquiries that were resolved through Knowledge available in the system.
Channel here represents the mediums or systems through which Knowledge can be accessed such as Luma Virtual Agent, Luma Knowledge Search Widget.
...
Feedback Response Rate
The Feedback response rate chart represents the percentage of feedback received on artifacts against the Target feedback rate (configurable) set for the channel.
| Info |
|---|
Feedback is critical in improving successful searches and effective artifacts. It enables the curator to keep knowledge in the system up to date and useful. |
...
Volume and Accuracy
This chart represents the total volume of user sessions against the Observed accuracy by channel. Here, we can view the total number of user inquiries for a channel and the accuracy of the artifact retrieval for the specified period.
| Info |
|---|
Volume is the indicator of Luma knowledge usage by the end-users, and any dip in the channel volume from one period to another should be investigated. Accuracy between channels should be similar. Any dip in accuracy or low accuracy outliers should be investigated. Higher accuracy channels should be analyzed to determine how the higher level of accuracy is being achieved, and those lessons should be applied to the other channels. |
...
Guided Response and Accuracy
This chart represents the total number of responses for Guided search against the Observed accuracy by channel. Here, we can view the total number of user inquiries for a channel guided by topics and the accuracy of the artifact retrieval for the specified period.
| Info |
|---|
Guided conversions are an effective means of finding knowledge in the system, dependent on the topic-artifact hierarchy. Comparing the guided response and accuracy by channel highlights if the artifact hierarchy is effective. Also, the volume (% rate) of guided conversions should be similar across channels. Lower or no volume should be investigated, and the knowledge base should be updated accordingly. |
...
Knowledge Usage
Average Quality Index
The Artifact Quality Index (AQI) is used to monitor the effectiveness of artifacts in solving users’ needs. It must be measured in the context of their domain and user audience.
The chart represents Volume versus Artifact AQI per domain for the specific time period. Here we can view the total number of user inquiries for a channel and the accuracy quality of the artifact retrieval returned for the specified period.
| Info |
|---|
Volume is the indicator of Luma knowledge usage by the end-users, and any dip in the channel volume from one period to another should be investigated. Accuracy between channels should be similar. Any dip in accuracy or low accuracy outliers should be investigated. Higher accuracy channels should be analyzed to determine how the higher level of accuracy is being achieved, and those lessons should be applied to the other channels. |
...
Guided Response and Accuracy
This chart represents the total number of responses for Guided search against the Observed accuracy by channel. Here, we can view the total number of user inquiries for a channel guided by topics and the accuracy of the artifact retrieval for the specified period.
| Info |
|---|
Guided conversions are an effective means of finding knowledge in the system, dependent on the topic-artifact hierarchy. Comparing the guided response and accuracy by channel highlights if the artifact hierarchy is effective. Also, the volume (% rate) of guided conversions should be similar across channels. Lower or no volume should be investigated, and the knowledge base should be updated accordingly. |
...
Knowledge Usage
Average Quality Index
The Artifact Quality Index (AQI) is used to monitor the effectiveness of artifacts in solving users’ needs. It must be measured in the context of their domain and user audience.
The chart represents Volume versus Artifact AQI per domain for the specific time period. Here we can view the total number of user inquiries and the quality of artifact returned for the user inquiries for each Domain. Artifact quality is derived from User feedbacks.
...
This information indicates that quality across domains should be similar. Low-performing domains should be investigated to improve artifact quality.
...
The type of media used can have a major impact on the approachability, understandability, and, ultimately, usefulness of an artifact. For example, videos tend to be better than documents, albeit at a cost. This statistic enables curators to decide what type of media makes the most sense and whether they should spend the extra money on media production (i.e., video) to get a better outcome.
...
user inquiries for each Domain. Artifact quality is derived from User feedbacks.
...
This information indicates that quality across domains should be similar. Low-performing domains should be investigated to improve artifact quality.
The type of media used can have a major impact on the approachability, understandability, and, ultimately, usefulness of an artifact. For example, videos tend to be better than documents, albeit at a cost. This statistic enables curators to decide what type of media makes the most sense and whether they should spend the extra money on media production (i.e., video) to get a better outcome.
Since artifacts have an intended audience. So tracking the effectiveness by user type (audience) is very important. What works well for an analyst may not be understandable to an SSU, let alone a Guest. And of course, having artifacts targeted to specific user types is often necessary, if not required, for security reasons. Seeing where quality is not up to the highest level provides investigative insight into the potential need changes the media presented to that audience, address curator performance or quality of the source. Ideally, the AQI would be similar across all user types and outliers explored.
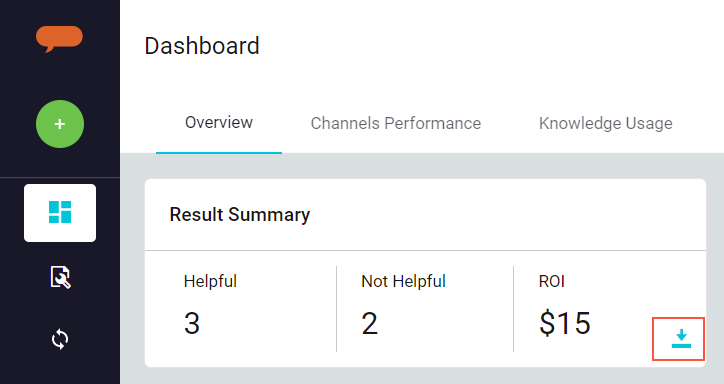
Download Dashboard Reports
You can also download and view the metrics information generated for the various segments on the Luma Knowledge Dashboard. You can click on the download button and download the reports in CSV format.
...
The information will be downloaded in a CSV file, which can be saved on your local system.
The following reports can be downloaded from the dashboard:
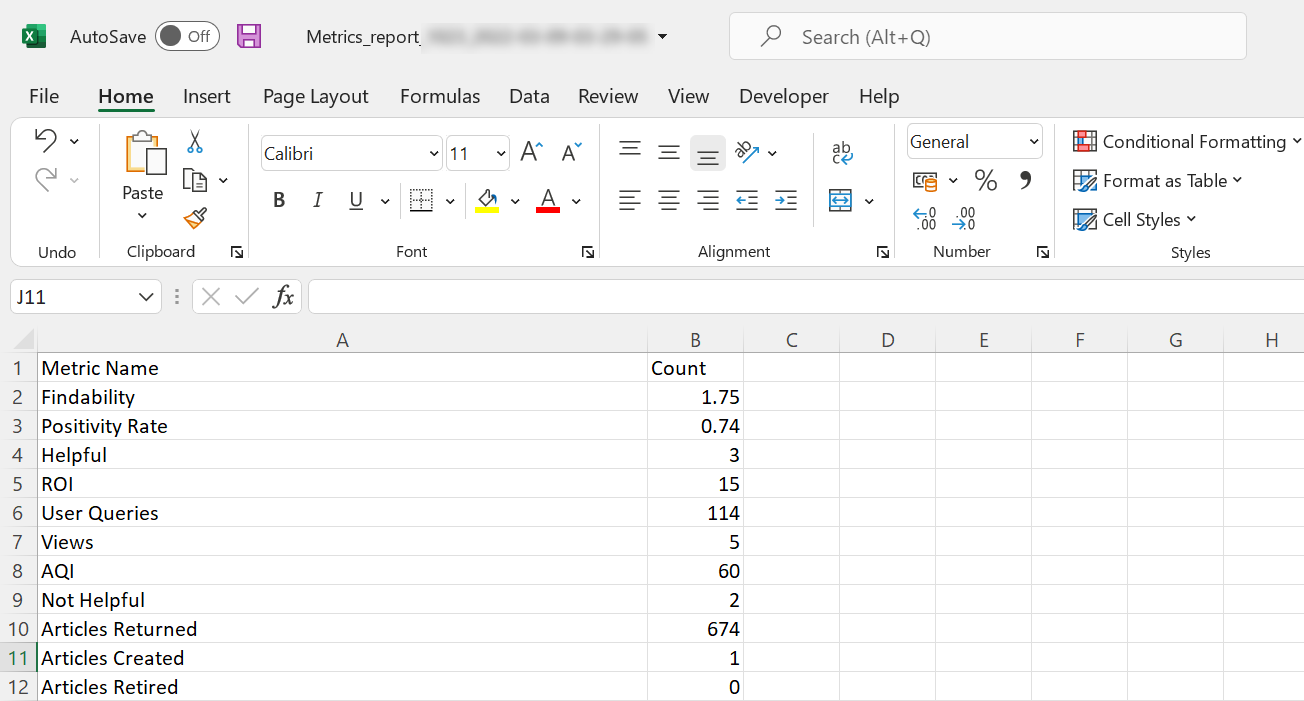
Dashboard Metrics Report: This is the summary report that contains all the metrics available on the Luma Knowledge Dashboard.
Click on the download button at the top of the Dashboard to down the report.

Here you can find the Metrics name and the associated counts displayed or used to build the graphs or visual representations.
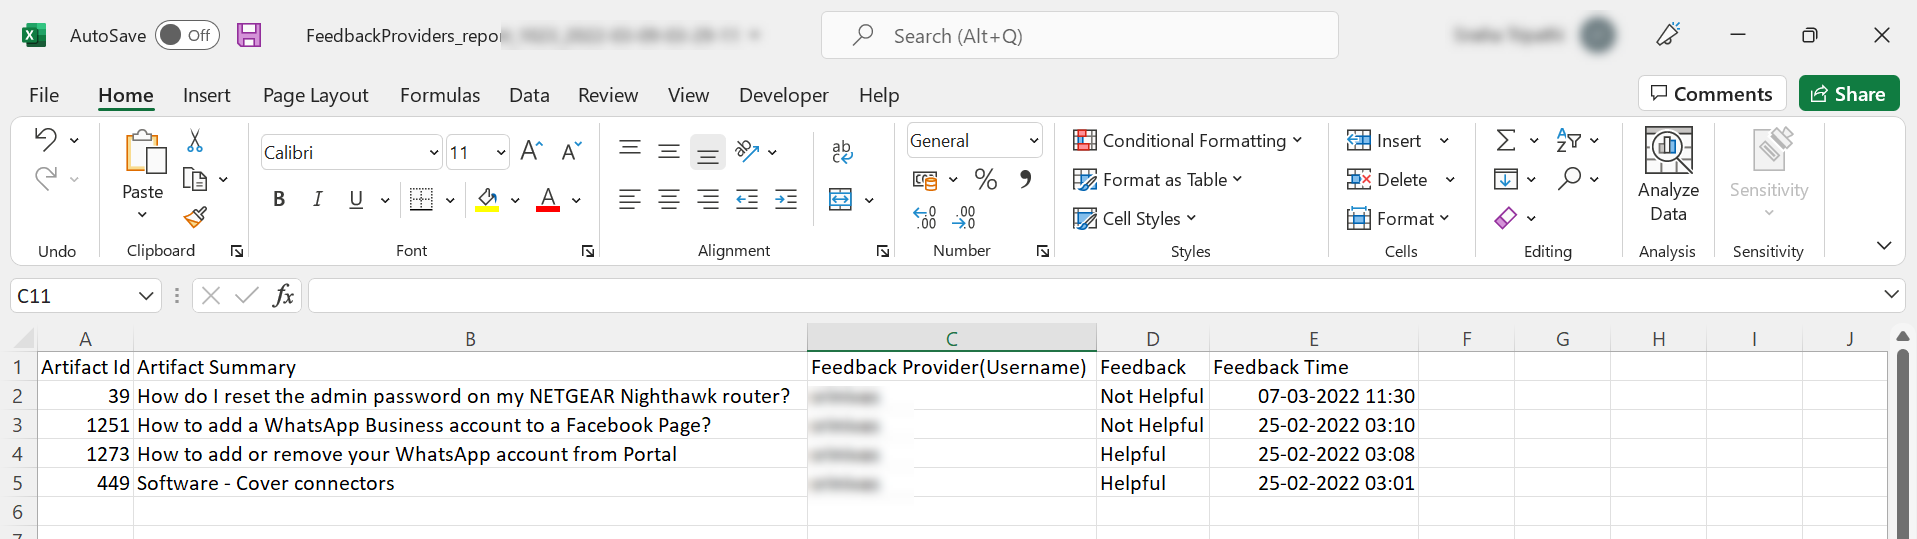
User Feedback Report: The report provides information on Positive and Negative feedback received for Artifacts in Luma Knowledge. The information enables the administrators to get in-depth information on how the 'Result Summary' metrics are calculated.
Click on the download button at the 'Result Summary' metric.
A CSV file is generated with the following details:
Artifact Id represents the Artifact for which a feedback (positive or negative) is received. The report field contains the Artifact’s Id in Luma Knowledge.
Artifact summary is the summary of the Artifact.
Feedback Provider(Username) is the user who has provided the feedback.
Feedback:This is the feedback recieved for the Artifact. A user may find the artifact Helpful (positive feedback) or Not Helpful (negative feedback).
Feedback Time is the date and time when user feedback is received.