Dashboard displays a collection of visualizations depicted in the form of graphs and metrics to provide you a comprehensive snapshot of your service desk to analyze data at a glance without having to drill down too many reports. The dashboard lets you visualize your organization’s data in the simplest graphical forms, track performance metrics, monitor unassigned tasks and helps enhance future decision making. You can search, view, edit, save, and export the dashboard content to Analysts and Administrators can access the Dashboard workspace.
To learn about customizing the Dashboard, see Customize the Dashboard.
Navigation
To navigate to the Dashboard, click Dashboard(Beta) from the Reports menu.
The following out-of-the-box dashboards are available on the left navigation pane within the Dashboard workspace.:
| Report Name | Description |
|---|
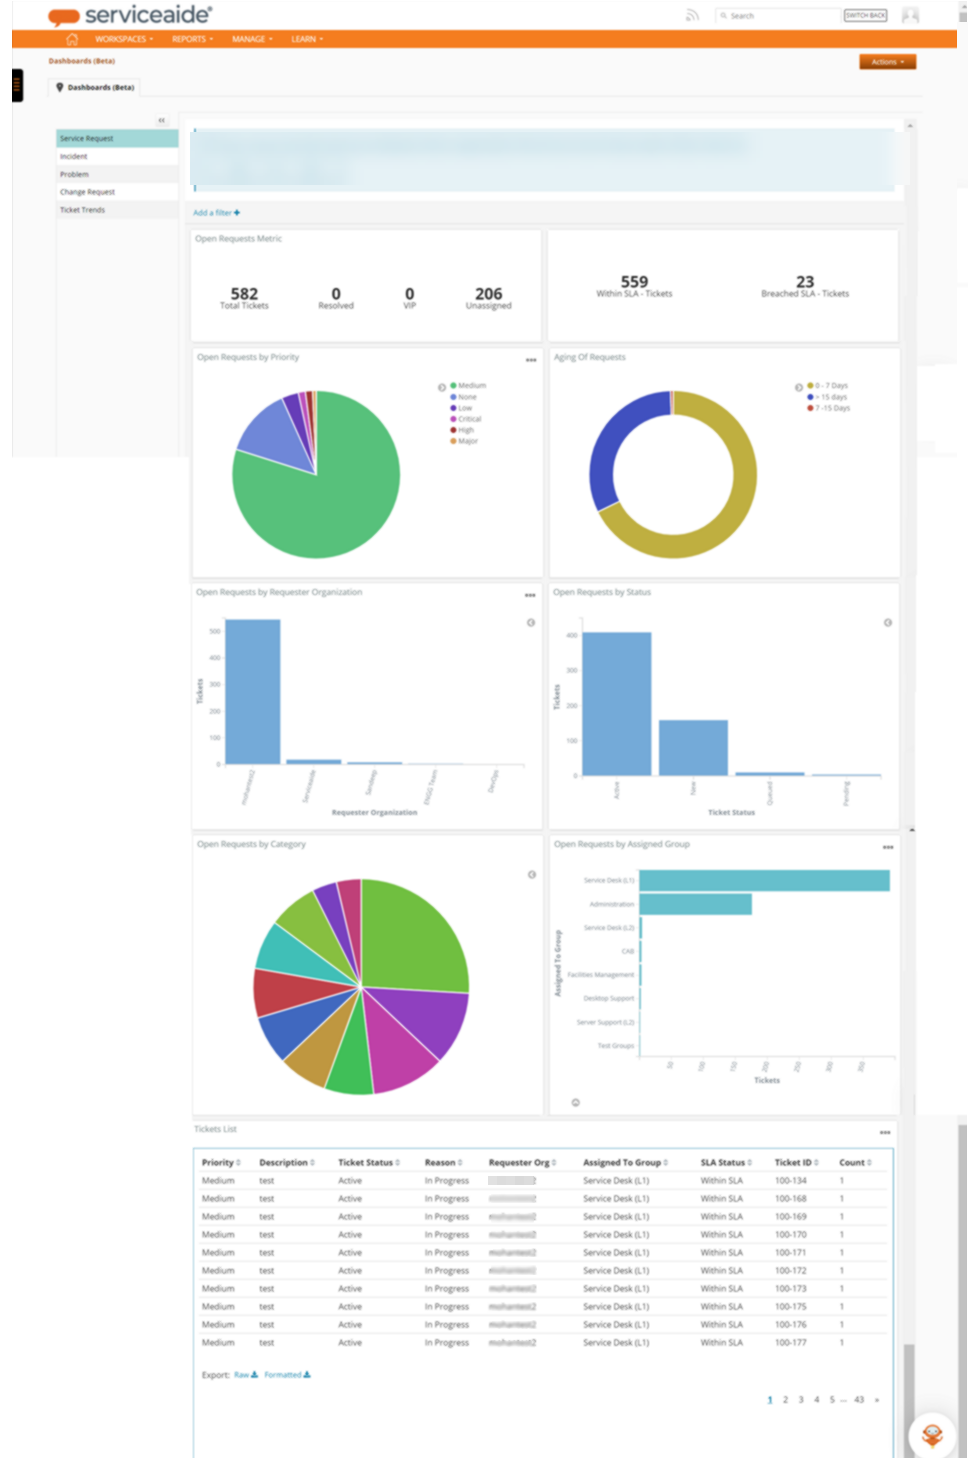
| Service Request | Displays a snapshot of open Service Requests sorted by Category, Group, Age, Status, and Priority where the tickets are not closed or not resolved.
Total Tickets: Total Requests metric/scorecard displays the numerical format of the total number of Service Requests logged/created. Resolved: Displays the scorecard for the total number of Service Requests with the Status Resolved or Closed and Date Resolved or Date Closed whichever comes first. VIP: Displays the scorecard for the total number of Service Requests whose Requester OR Requested For is a VIP. Unassigned: Displays the scorecard for the total number of Service Requests whose Assigned field is blank. Within SLA - Tickets: Displays the scorecard for the total number of Service Requests whose SLA with the Status Within SLA. - Approaching Violation: Displays the scorecard for number of Incidents with the SLA Status set to Approaching Violation.
Breached SLA - Tickets: Displays the scorecard for the total number of Service Requests whose SLA with the Status Breached SLA
- Priority
- Description
- Ticket Status
- Reason
- Requester Org
- Assigned to Group
- SLA Status
- Ticket ID
- Count
|
| Incident | Displays a snapshot of open Incidents sorted by Category, Group, Age, Status, and Priority. The Dashboard Metrics displays the following: - Total Tickets: Displays the scorecard for the total number of Incidents logged/created.
- Resolved: Displays the scorecard for the total number of Incidents with the Status Resolved and Date Resolved.
- VIP: Displays the scorecard for the total number of Incidents whose Requester OR Requested For is a VIP.
- Unassigned: Displays the scorecard for the total number of Incidents whose Assigned field is blank.
Within SLA - Tickets: Displays the scorecard for number of Incidents with the SLA Status set to within SLA. - Approaching Violation: Displays the scorecard for number of Incidents with the SLA Status set to Approaching Violation.
Breached SLA - Tickets: Displays the scorecard for the total number of Incidents with the SLA Status set to Breached SLA.
The following charts are displayed on the Dashboard: - Open Incidents by Priority
- Aging of Incidents
- Open Incidents by Requester organization
- Open Incidents by Category
- Open incidents by Assigned Groups
- Average Resolution by Category
The following data is displayed in the grid on the Dashboard: - Priority
- Description
- Ticket Status
- Reason
- Requester Org
- Assigned to Group
- Created Date
- SLA Status
- Updated Date
- Ticket ID
- Count
|
| Problem | Displays a snapshot of open Problems sorted by Category, Group, Age, Status, and Priority. The Dashboard Metrics displays the following: - Open Problems: Displays the scorecard for the total number of Problem Tickets with the Status Opened.
- Open Critical: Displays the scorecard for the total number of Problem Tickets with Priority Critical.
- Resolved: Displays the scorecard for the total number of Problem Tickets with the Status Resolved.
- Unassigned: Displays the scorecard for the total number of Problem Tickets which are Unassigned.
The following charts are displayed on the Dashboard: - Open Problem by Category
- Open Problem by Status
- Problem Queue Rate
- Open Problem by Assigned Groups
- Incident vs Problem
The following data is displayed in the grid on the Dashboard: - Priority
- Description
- Ticket Status
- Reason
- Requester Org
- Assigned to Group
- Created Date
- SLA Status
- Updated Date
- Ticket ID
- Count
|
| Change Request | Displays a snapshot of open Change Requests sorted by Category, Type, and Group. The Dashboard Metrics displays the following: - Open Changes: Displays the scorecard for the total number of Change Requests with the Status Opened.
- Approved: Displays the scorecard for the total number of Change Requests with the Status Approved.
- Unassigned: Displays the scorecard for the total number of Change Requests which are unassigned.
- Scheduled: Displays the scorecard for the total number of Change Requests which are Scheduled.
- Unscheduled: Displays the scorecard for the total number of Change Requests which are Unscheduled.
- Resolved: Displays the scorecard for the total number of Change Requests which are Resolved.
The following charts are displayed on the Dashboard: - Open Changes by Type
- Open Incidents by Category
- Active Tickets by Group
The following data is displayed in the grid on the Dashboard: - Priority
- Description
- Ticket Status
- Reason Code
- Requester Org
- Assigned to Group
- Created Date
- Updated Date
- SLA Status
- Case
- Open Changes
|
| Ticket Trends | the data depicting top 5 ticket trends for a selected date . The following charts are displayed on the Dashboard: - Tickets by SLA
- Resolution Rate by Category in Days
|
| Set as Home Page | Click Set as Home Page from the Actions menu to set the Dashboard page as your Home Page. |
 | Click the icon to expand or collapse the dashboard navigation on the left. |
 | Click the icon to navigate to the top when you are at the bottom of the page. |
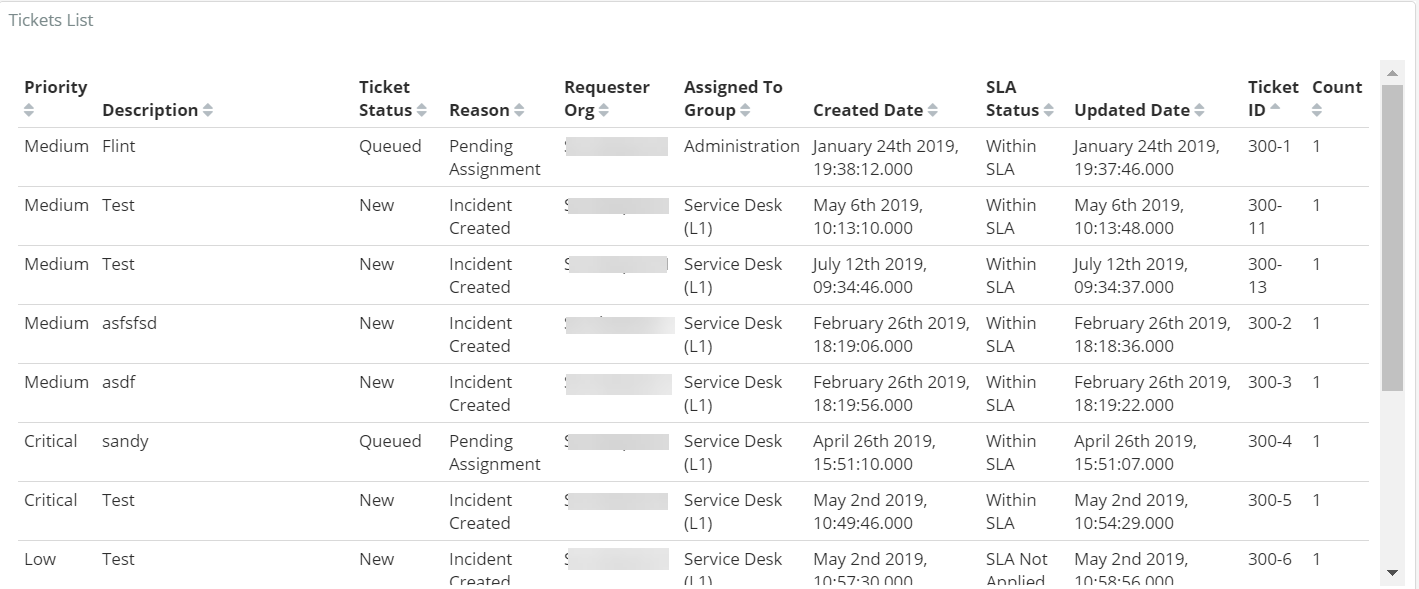
Ticket List
The ticket data for the selected Dashboard is displayed in a grid format based on the categories available. For example, if you select the Incident OOTB (Out-of-the-box) dashboard, the tabular data shows as below:
Add Comment