Service View and Definition
- Former user (Deleted)
- priti.hota (Deactivated)
- Amy Le (Unlicensed)
- Former user (Deleted)
This article contains the following topics:
Service View is only available in the ISM Service Management edition. This feature is not available in the ISM Service Desk edition.
What Is a Service?
A Service is an integrated entity that consists of several components, such as management processes, hardware, software, facilities, and people, that provide a capability to satisfy a stated management need or objective. An IT Service is made up of a combination of assets and configuration items and can be defined in a Service Level Agreement. An IT service ranges from accessing a single application, such as a ledger system, to a complex set of facilities including many applications that are spread across several hardware and software platforms. The key benefit of using services to manage IT is that you can easily see when incidents affect configuration items. These incidents, problems, and requests contribute to the metrics that you can view in the Service Pulse workspace.
Service View
Service View provides IT Managers with access to the key metrics of the IT services in their organization for a selected time period. To access Service View, navigate to WORKSPACES> SERVICE PULSE> Service View. Service view allows you to define a service and view the metrics for that service. These metrics provide an actionable insight into the performance of the service that helps IT Managers meet their service objectives.
Service View helps you accomplish the following goals:
- Discover the health of your key services.
- Manage service availability by finding and fixing problems early.
- Reduce cost and improve efficiency through more informed decision making.
Service View shows you the health of a service, by providing information about:
- How the services in your organization are performing?
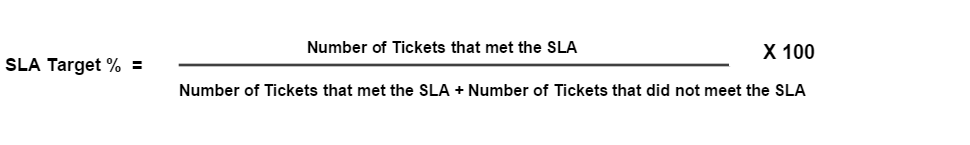
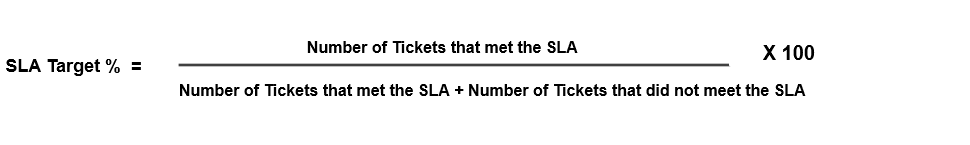
- How is the service adopted across the organization?
- What % of tickets met the Service Level Agreement Response Target time for a service?
- How many open critical incidents are there for a service?
- What types of incidents and problems are created for the service?
- What is the resolution time for tickets reported against a service?
Service view displays data based on a scheduled job, which runs in the background at a fixed periodic interval (24hrs). The data displayed under the service view is not real-time data and it is updated as a result of the background job. The data related to the adoption and performance of a service contributes to the metrics displayed in the service view.
Note: These metrics are not configurable. For the bamboo release, there is no option to add new metrics or modify the existing ones. Also no customizations are available for these metrics, which means you cannot select what metrics appear on service view.
Service view offers a set of six predefined metrics that indicate the health of the services in your organization:
- Highest/Lowest Number of Incidents/Problems
- Highest/Lowest Response SLA Target Percentage
- Highest/Lowest Number of Unique Requestors
- Highest/Lowest Resolution Time
- Highest/Lowest Number of Change/Service Requests
- Highest/Lowest Number of Open Critical Incidents/Problems
Turn on Service View
Service is not a new object, it is a configuration item that is classified as a service, using a configuration parameter. The slice configuration parameter SLA_BUSINESS_SERVICES_IDENTIFIER_CLASSES is used to identify services. It lets you configure which CCTI classes appear under the service category. For example, if you want all the applications to appear as service, all the CIs that have the class Service or Application are categorized as a service. For more information about this configuration parameter, see SLA Business Service Identifier Classes.
Roles and User Permissions
This application provides an out-of-the-box role that is named Service Owner. The Service Owner role lets users view, create, and manage all services from a single work space.
As an Administrator, you can define the users and provide access permissions to the users for Service View workspace. You provide permissions to any user to view, create, and manage services by adding them to the Service Owner Role.
Filter Services Data
Use the Filter option to search for services using specific criteria.

You can filter the services data based on the following criteria:
- Organization: Lets you view the metrics that belong to a specific organization.
- Service Owner: Lets you view the metrics of services that are owned by a specific service owner.
- By Time Period: Lets you apply the filter for a given time period. For example, the Last 7 days, 30 days, 90 days, and the Last Month. By default, service view displays the metrics of the last 30 days. You can change the period by modifying this filter.
Note: A month is calculated from the first day of the month to the last day of the month.
A scheduled background job aggregates and populates the data that is displayed under the Key Services and the Highest Trending Services by Incidents/Problems. When the job is run for the first time, it loads the ticket data for the past 180 days. However, the application does not provide an option to change the schedule.
Note: The filter is only applied for the following sections:
- Key Services
- Warning Metrics
- Normal Metrics
- Highest Trending Services by Incidents/Problems
Key Services
Service View displays adoption/usage trend of the key services. You can view the performance of the key services under Warning Metrics and Normal Metrics. Click a number to view the tickets that are associated with that particular metric for a service. Click the Service to view the service details page. All the incidents, problems, and change requests that are created for the services, contribute to the metrics that are displayed under the Key Services section in the Service View page.
Warning Metrics
The Warning Metrics tab displays metrics for the services which require some attention. Service View displays Warning Metrics under the Key Services section. Based on the service data available under the warning metrics, you can identify the root cause and fix the issues with that particular service.
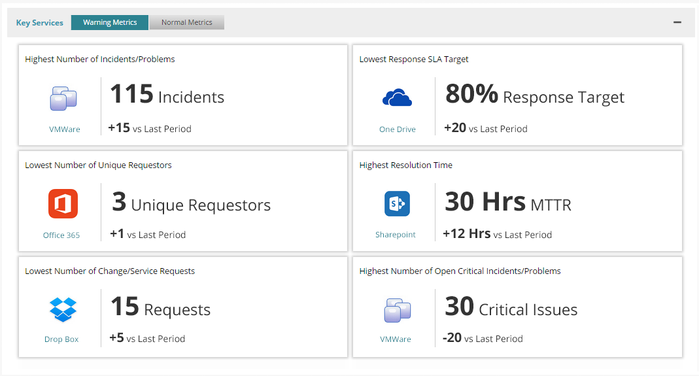
The Warning Metrics tab displays information about the following metrics:
Highest Number of Incidents/Problems
Displays the service with the highest number (quantity) of reported incidents and problems. The (+/-) sign represents variation from the last period. Among all the services in your organization, if the VMware service has the highest number of incidents and problems in the current period, then it appears under the Warning Metrics tab.
For example, consider the following two scenarios:
- In the last period, 100 incidents/problem tickets were created for the VMware service.
- In the current period, 115 incidents/problem tickets are created for the same service.
In this case, the variation is +15 vs Last Period.
Similarly, if:
- In the last period, 100 incidents/problem tickets were created for the VMware service.
- In the current period, 85 incidents/problem tickets are created for the same service.
In this case, the variation is -15 vs Last Period.
Lowest Response SLA Target
Displays the service with the lowest percentage of tickets that met the Response SLA Target. The (+/-) sign represents variation from the last period. Among all the services in your organization, if the One Drive service has the lowest response target, then it appears under the Warning Metrics tab.
For example, consider the following two scenarios:
- In the last period, 10 tickets were created for the One Drive service out of which only 6 tickets met the SLA and 4 tickets breached the SLA, so the response target for that service is 60 percent.
- In the current period, the response target for One Drive service is 80 percent.
In this case, the variation is +20 vs Last Period.
Similarly, if:
- In the last period, 10 tickets were created for the One Drive service out of which only 6 tickets met the SLA and 4 tickets breached the SLA, so the response target for that service is 60 percent.
- In the current period, the response target for One Drive service is 50 percent.
In this case, the variation is -10 vs Last Period.
To verify this calculation, click the percentage value for the Minimum Response Target metric. All the tickets that are created for this service appear under the tickets drill down tab. View the SLA Response Status column to confirm the calculation.
The following service level metrics are considered for calculating the Response Target:
- Response Time for Support Group (Service Availability Hours)
- Response Time for Support Group (Support Group Business Hours)
- Response Time for Support Group (24x7 Support)
- Response Time By Status (Service Availability Hours)
- Response Time By Status (Support Group Business Hours)
- Response Time By Status (24x7 Support)
Note: The tickets for which SLA is not applied are not considered to calculate this metric.
Lowest Number of Unique Requestors
Displays the service, with the lowest number (quantity) of unique ticket requestors, that requested the service. The (+/-) sign specifies the variation from the last period. Among all the services in your organization, if the Office 365 service has the least number of unique requestors then it appears under the Warning Metrics tab.
Note: The Requestor field on the ticket is considered to calculate this metric.
For example, consider the following two scenarios:
- In the last period, 10 tickets (service request and change request) were created for the Office 365 service by 2 unique users. Then the unique requestors for that service are two.
- In the current period, 3 unique users requested the same service.
In this case, the variation is +1 vs Last Period.
Similarly if,
- In the last period, 10 tickets (service request and change request) were created for the Office 365 service by 2 unique users. Then the unique requestors for that service are two.
- In the current period, only 1 unique user requested the same service.
In this case, the variation is -1 vs Last Period.
Highest Resolution Time
Displays the service with the highest average time taken to resolve/close the incidents and problems. The time from when the (incidents/problems) ticket was open to the time when it is resolved/closed is considered to calculate this metric. The Highest Resolution Time metric, shows the average time that is taken to resolve for all incidents and problems that are created in the current period for that service. The Working Hours, Support Group Working Hours, and SLA Holding Time are not considered to calculate this metric. The (+/-) sign represents variation from the last period. In the current period, among all the service in your organization the Share Point service has the highest resolution time then it appears under the Warning Metrics tab.
Note: Resolved time or Closed time whichever is later is used to calculate the metric.
For example, consider the following two scenarios:
- In the last period, two tickets were opened, the first on 12/12/2014 at 11:00 AM and was resolved/closed on 12/13/2014 at 11:00 AM. The second ticket was opened on 12/13/2014 at 11:00 AM and it was resolved/closed on 12/13/2014 at 11:00PM. Hence the resolution for the first ticket is 24 hours and for the second ticket is 12 hours. So the average ticket resolution time is 18 hours for the last period.
- In the current period, the average ticket resolution time is 30 hours.
In this case, the variation is +12 Hrs vs Last Period.
Similarly if,
- In the last period, two tickets were opened, the first on 12/12/2014 at 11:00 AM and it was resolved/closed on 12/13/2014 at 11:00 AM. The second ticket was opened on 12/13/2014 at 11:00 AM and it was resolved/closed on 12/13/2014 at 11:00PM. Hence the resolution for the first ticket is 24 hours and for the second ticket is 12 hours. So the average ticket resolution time is 18 hours for the last period.
- In the current period, the average ticket resolution time is 15 hours.
In this case, the variation is -3 Hrs vs Last Period.
Lowest Number of Change/Service Requests
Displays the service against which the lowest number (quantity) of service requests or change requests were created during a given time period. This metric indicates information about the adoption of a service. The (+/-) sign represents variation from the last period. In the current period, if the Drop Box service had the lowest number of change/service requests, then the adoption for this service is poor. As a result, it appears under the Warning Metrics tab.
For example, consider the following two scenarios:
- In the last period, 10 change/service requests were created for the Drop Box service.
- In the current period 15 change/service requests are created for the same service.
In this case, the variation is +5 vs Last Period.
Similarly if,
- In the last period, 10 change/service requests were created for the Drop Box service.
- In the current period, 5 change/service requests are created.
In this case, the variation is -5 vs Last Period.
Highest Number of Critical Incidents/Problems
Displays the service against which the highest number (quantity) of open critical incidents and problems were reported. The (+/-) sign represents variation from the last period. In the current period, among all the services in your organization, most of the critical tickets were reported for the VMware service. As a result, VMware service is displayed under the Highest Number of Critical Incidents/Problems of the warning metrics tab.
Note: The criticality of the open ticket is calculated based on the Priority field of the ticket.
The tickets that have the following statuses are not considered to calculate this metric:
- Resolved
- Closed
- Archive
- Complete
- Request-Delete
For example, consider the following two scenarios:
- In the last period, 50 critical incidents/problems tickets were created for the VMware service.
- In the current period, 75 incidents/problems are created for the same service.
In this case, the variation is +25 vs Last Period.
Similarly if,
- In the last period, 50 critical incidents/problems tickets were created for the VMware service.
- In the current period, 30 incidents/problems are created for the same service
In this case, the variation is -20 vs Last Period.
Normal Metrics
The Normal Metrics tab displays the metrics for the services that are performing as expected. Service View displays Normal Metrics under the Key Services section. Navigate to the Normal Metrics tab to identify the services that are performing well.
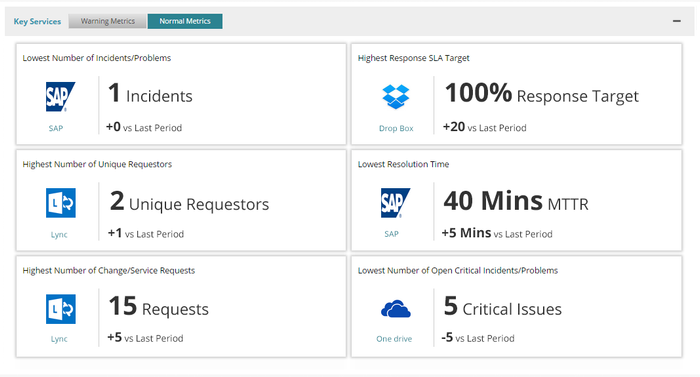
The Normal Metrics tab displays information about the following metrics:
Lowest Number of Incidents/Problems
Displays the service with the lowest number (quantity) of reported incidents and problems. The (+/-) sign represents variation from the last period. In the current period, among all the services in your organization, the SAP service has the lowest number of incidents and problems. As a result, the SAP service appears under the Normal Metrics.
For example, consider the following two scenarios:
- In the last period, only one incident/problem ticket was created for the SAP service.
- In the current period, also only one incident/problem ticket is created against the SAP service.
In this case, the variation is +0 vs Last Period.
- In the last period, only one incident/problem ticket was created for the SAP service.
- In the current period, no incident/problem ticket is created against the SAP service
In this case, the variation is -1 vs Last Period.
Highest Response SLA Target
Displays the service with the highest percentage of tickets that met the Response SLA Target. The (+/-) sign represents variation from the last period. In the current period, among all the services in your organization, the Dropbox service has the Highest Response SLA Target. As a result, the Drop Box service appears under the Normal Metrics.
For example, consider the following two scenarios:
- In the last period, 10 tickets were created for the Drop Box service out of which only 8 tickets met the SLA and no tickets breached the SLA, so the response target for that service is 80 percent.
- In the current period, the response target for Drop box service is 100 percent.
In this case, the variation is +20 vs Last Period.
Similarly if,
- In the last period, 10 tickets were created for the Drop Box service out of which only 8 tickets met the SLA and no tickets breached the SLA, so the response target for that service is 80 percent.
- In the current period, the response target for Drop box service is 50 percent.
In this case, the variation is -30 vs Last Period.
The following service level metrics are considered for calculating the Response Target:
- Response Time for Support Group (Service Availability Hours)
- Response Time for Support Group (Support Group Business Hours)
- Response Time for Support Group (24x7 Support)
- Response Time By Status (Service Availability Hours)
- Response Time By Status (Support Group Business Hours)
- Response Time By Status (24x7 Support)
Highest Number of Unique Requestors
Displays the service with the highest number (quantity) of unique ticket requestors, that requested the service. The (+/-) sign specifies the variation from the last period. In the current period, among all the services in your organization, the Lync service has the highest number of unique requestors. As a result, the Lync service appears under the Normal Metrics tab.
Note: The Requestor field on the ticket is considered to calculate this metric.
For example, consider the following two scenarios:
- In the last period, 10 tickets (service request and change request) were created for the Lync service by 2 unique users. Then the unique requestors for that service are 2.
- In the current period, 2 other users requested the same service.
In this case, the variation is +1 vs Last Period.
Similarly if,
- In the last period, 10 tickets (service request and change request) were created for the Lync service by 2 unique users. Then the unique requestors for that service are 2.
- In the current period, only 1 unique user requested the same service.
In this case, the variation is, -1 vs Last Period.
Lowest Resolution Time
Displays the service that has the lowest average time taken to resolve for all tickets(incidents/problems) created in the current period for that service. The time from when the ticket was open to the time when it is resolved/closed is considered to calculate this metric. The Working Hours, Support Group Working Hours, and SLA Holding Time are not considered to calculate this metric. The (+/-) sign represents variation from the last period. In the current period, among all the services in your organization, the SAP service has the lowest resolution time. As a result, the SAP service appears under the Normal Metrics tab.
Note: Resolved time or Closed time, whichever is later, is used to calculate the metric.
For example, consider the following two scenarios:
- In the last period, two tickets were opened against the SAP, the first on 01/01/2014 at 08:00 AM and it was resolved/closed on 01/01/2014 at 08:30 AM. The second ticket was opened on 01/02/2014 at 11:00 AM and it was resolved/closed on 01/02/2014 at 11:40 AM. Hence the resolution for the first ticket is 30 minutes and for the second ticket is 40 Min. So the average ticket resolution time is 35 minutes.
- In the current period, if the ticket resolution time is 40 minutes, for the same service.
In this case, the variation is, +5 mins vs Last Period.
Similarly if,
- In the last period, two tickets were opened against the SAP, the first on 01/01/2014 at 08:00 AM and it was resolved/closed on 01/01/2014 at 08:30 AM. The second ticket was opened on 01/02/2014 at 11:00AM and it was resolved/closed on 01/02/2014 at 11:40 PM. Hence the resolution for the first ticket is 30 minutes and for the second ticket is 40 Min. So the average ticket resolution time is 35 minutes.
- In the current period, the ticket resolution time is 15 minutes, for the same service.
In this case, the variation is, -20 mins vs Last Period.
Highest Number of Change/Service Requests
Displays the service against which the highest number (quantity) of service or change requests were created during a given time period. This metric indicates information about the adoption of a service. The (+/-) sign represents variation from the last period. In the current period, among all the service in your organization, the Lync service had the highest number of change/service requests. This means that adoption for this service is good, and hence, it appears under the Normal Metrics
For example, consider the following two scenarios:
- In the last period, 10 change/service requests were created for the Lync service.
- In the current period, 15 change/service requests are created for the same service.
In this case, the variation is, +5 vs Last Period.
Similarly if,
- In the last period, 10 change/service requests were created for the Lync service.
- In the current period, 5 change/service request are created for the same service.
In this case, the variation is, -5 vs Last Period.
Lowest Number of Critical Incidents/Problems
Displays the service against which the lowest number (quantity) of critical incidents and problems were reported. The criticality of the open ticket is calculated on the Priority field of the ticket. The (+/-) sign represents variation from the last period. In the current period, among all the services in your organization, the lowest number of critical tickets were reported for the Lync service. As a result, the Lync service is displayed under the lowest number of critical incidents/problems section of the Normal Metrics tab.
Note: The criticality of the open ticket is calculated based on the Priority field of the ticket.
The tickets that have the following statuses are not considered to calculate this metric:
- Resolved
- Closed
- Archive
- Complete
- Request-Delete
For example, consider the following two scenarios:
- In the last period, 10 critical tickets (incidents and problems) were created against the One Drive services.
- In the current period, the 15 incidents/problems requests are created for the same service.
In this case, the variation is, +5 vs Last Period.
Similarly if,
- In the last period, 10 critical tickets (incidents and problems) were created against the One Drive services.
- In the current period, 5 incidents/problems are created for the same service.
In this case, the variation is, -5 vs Last Period.
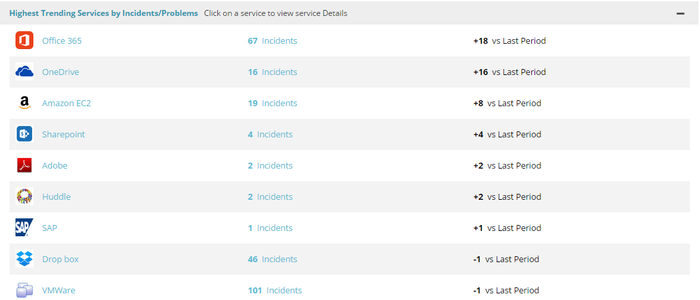
Highest Trending Services by Incidents/Problems
Displays the top ten services, which move on the top of the list, which is based on incidents/problems that are created in the current period vs the last period.
For example,
- In the current period, 50 incidents/problems were created for the Office 365 service.
- In the last period, 30 incidents/problems were created for the same service.
In this case, the variation is, +20 vs Last Period .
Similarly if,
- In the current period, 60 incidents/problems were created for the Office 365 service.
- In the last period, 50 incidents/problems were created for the same service.
In this case, the variation is, +10 vs Last Period.
The Office 365 service has the maximum variance as compared to the last period hence appears on the top of the list. The time period filter allows you to view data for a given time period.
Based on the applied time period filter the data is displayed for the current period with the variance from the last period. The ticket drill-down allows you to analyze and investigate the tickets that contribute to a particular metric. Click the Service Name to view the service detail screen, for example Office 365. Click the number to view the list of incidents and problems that contribute to the metric value, for example, 67 incidents.
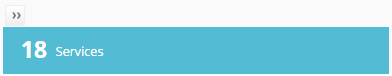
View Services
Displays the total number of active services available to the service owner/administrator based on the organization the user has access to. From the top right side of the Service View, click Services to view a list of all the services that are active in the slice.
Note: The Services option indicates the quantity of the services that are active in the slice, as illustrated by the following graphic:
Click Services to view the list of all services with the following details:
- Service Name
- Status
- Number of Incidents/Problems
- Response Target Percentage
- Unique Requestors
- Service/Change Requests
- Open Critical Incidents/Problem tickets
Service Update
The Services Update displays the last five updates that occurred on tickets that were created against the services.

Click the Ticket link to view the ticket details screen.
Related content
© 2019 Serviceaide 1-650-206-8988 http://www.serviceaide.com info@serviceaide.com