Manage Ad Hoc Views
- Former user (Deleted)
- priti.hota (Deactivated)
- Amy Le (Unlicensed)
- Former user (Deleted)
Ad Hoc views are used to create reports with the type such as Table, Chart, and Crosstab. If you have the Ad Hoc view designer permissions, you can fetch data from source to create an Ad Hoc view. As an Ad Hoc view designer, you can perform the following tasks:
- Create and Edit Ad Hoc View
- Personalize the look of the report in the report viewer.
- Create tables, crosstabs, and chart views for the reports using the Ad Hoc Editor.
- Add and summarize fields, define groups, add label and title, and format data for each field.
Prerequisite
- You must have permissions to create and edit Ad Hoc Views.
Recommendation
- Selecting all fields from data sets while designing an Ad Hoc view results in query time-out. To avoid the query time-out, select only the fields that are necessary in the report criteria.
- The predefined data sets such as Project and Project Task are available in the Cloud SM domain to create Ad Hoc views. We recommend not to use the Shared domain for predefined data sets.
Review the following concepts before creating an Ad Hoc view:
- A Topic is an empty view, which is used as a template to create the Ad Hoc views. Topics are created to specify a data source and a list of fields with which you can create reports in the Ad Hoc Editor without having to define the data relationships. The Topic allows you to add data to a view, without choosing, prefiltering, or changing display names of the data. A Topic is created from a Domain in the server while creating an Ad Hoc view.
- A Filter limits the data that is returned by a report based on a comparison of fields and values. The filter is added as a "WHERE” clause within the report query and limits the data that is processed within the report.
For example, while designing an Ad Hoc view, apply organization filter to return information that is specific to an organization for Tickets data set. - The defined filters are used as Input Controls when a report is created from the Ad Hoc view. The user can provide values that are used in a Filter during the runtime. In some cases, the filter is parameterized to accept different comparison values from the end user at run time. The parameter is associated with an Input Control of the same name to allow the end user to pass values to the report.
Follow these steps:
Log in to Serviceaide Intelligent Service Management and navigate to REPORTS> SERVICE DESK> Advanced Reporting.
Advanced Reporting page opens with the list of available Ad Hoc views, Reports, and Dashboards.- To create an Ad Hoc view:
- Click Actions> Create Ad Hoc View. A new window opens to create an Ad Hoc View.
Select the data source from Topics or Domains and click Choose Data.
Note: Select Cloud SM/Domains/Cloud SM for in-built views. Select Shared/Domains/Custom Cloud SM while using custom fields.
The data chooser window opens.From the Source panel, select the fields that you want to add to the view. Add the selected fields to Selected Fields panel.
Note: New fields are added to the Tickets data set to extract data such as ticket age and pending time. Use these fields to get the consolidated information of two or more fields in the reports as necessary. The following fields are available under Source, Tickets:Name
Measures Description Ticket Age (in Days)
If the ticket is closed: Closed Date - Created Date
If the ticket is open: Current Date - Created Date
Used to know the age of the ticket from the time it is raised.
For example, if a ticket is created on the 21st of October and closed on the 23rd of October. The result is 2 days.
First Closure Time (in Days) First Closed Date - Created Date Displays the total number of days that are taken to first close the ticket from the date it was created.
For example, if a ticket is created on the 21st of October and closed on 23rd of October. The result is 3 days.
Last Closure Time (in Days)
Most Recently Closed Date - Created Date Commonly used in the scenario where the ticket is reopened and closed more than once. Displays the total number of days that are taken from the date the ticket is created to the latest closed date.
For example, a ticket is created on 21st October and closed on 23rd October. But the ticket is re-opened on 24th October with the reason that it was not resolved and it is closed on 27th October with proper resolution. The result is 7 days.
First Resolution Time (in Days) First Resolved Date - Created Date Displays the total number of days that are taken to first resolve the ticket from the date it was created.
For example, if a ticket is resolved on the 21st of October and the report is generated on the 23rd of October. The result is 2 days.
Last Resolution Time (in Days)
Last Resolved Date - Created Date Commonly used in the scenario where the ticket is reopened and resolved more than once. Displays the total number of days that are taken from the date the ticket is created to the latest resolution date.
For example, a ticket is created on 21st October and resolved on 23rd October. But the ticket is re-opened on 24th October with the reason that it was not resolved and it is resolved on 27th October with proper resolution. The result is 7 days.
Total Pending Time (in Days) -- Provides information about the total number of days that a ticket is in pending state.
For example, a ticket is created on 21st October and the status is changed to pending on 22nd October. The pending ticket depends on another ticket such as incident and moved to resolved state on 27th October, stating that the dependent resolution resolved this ticket. The result is 6 days.
(Optional) Click Pre-filter to set the filters. You can filter the data that is to be displayed in the report by setting the prefilters. Select the field and set the filer condition in the Filter panel. For example, to display the information about a laptop with tag name '234EF24', set the Asset Tag filter as 234EF24.
(Optional) To set the fields in the order you want, click Display. Reorder the fields as required. You can also specify a Display Label for each field, if necessary.
(Optional) To save the view and use as a template to create the Ad Hoc views, Click Save as Topic. Enter the name, description, and location.
Note: Do not change the default save location of the topic.Select one of the following view types:
Tables
Tables consist of columns, rows, and groups. The columns in a table correspond to the columns in the data source. They are included by adding fields or measures to the table in the Ad Hoc view. The Rows correspond to rows in the database. The information in each row depends on what columns are included in the table. The rows are grouped by identical values in any field with intermediate summaries for each grouped value.
The fields with the numeric values are displayed in the Measures panel. Measures contain summarized numeric values of the fields that you have added.
For example, an Ad Hoc view with Table view type is displayed as shown in the following image: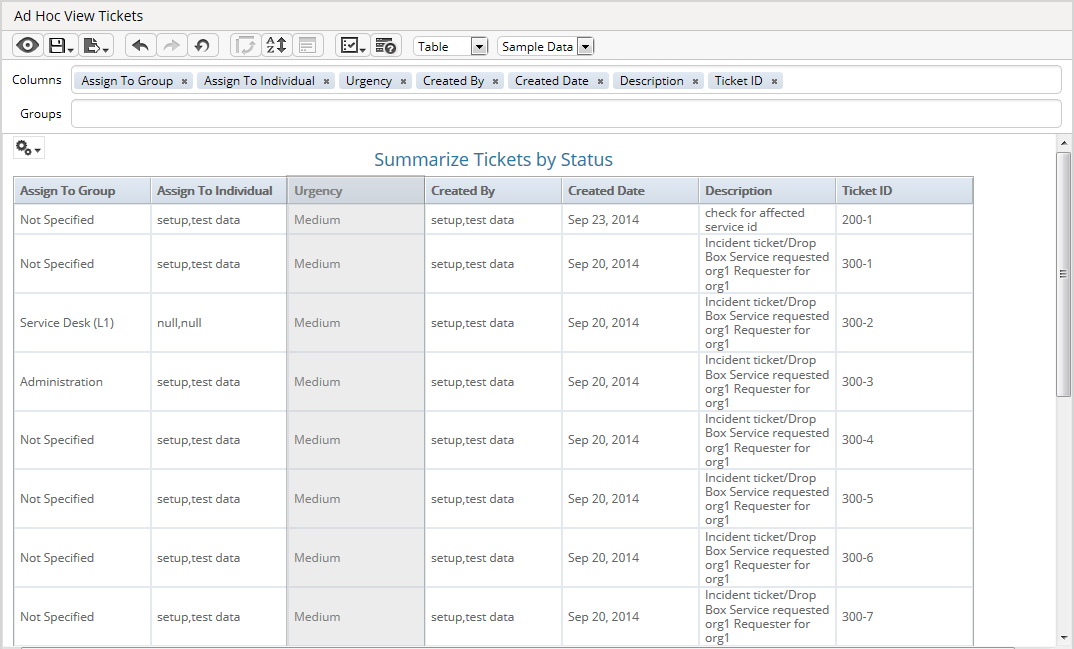
Charts
Charts summarize the data graphically and the charts include bar chart, line chart, and pie chart. Except for time series and scatter charts, each type of chart compares summarized values for a group.
The fields with the numeric values are displayed in the Measures panel. You add at least one measure to view a chart. Measures contain summarized numeric values of the fields that you have added. These fields determine the length of bars, size of pie slices, location of points, and height of areas. For example, fields such as Ticket ID, Priority_Code, Job_ID, and Asset_ID. You can add one or more measures to the chart as columns or rows. You cannot have one measure as a column and another as a row in the same chart.
Crosstabs
Crosstabs define more compact representations than tables and shows only the computed values. The columns and rows specify the dimensions for grouping and cells contain the summarized measurements.
The Measure labels are displayed in the crosstab depending on their status as a row or column. Measures are arranged in cells. You can add any number of measures. All the measures appear together in every cell. To rearrange the measures, drag them in the measure label area. To perform actions such as Change Summary Calculation and Create Filter, right-click a measure in the crosstab. You can add one or more measures to the chart as columns or rows. You cannot have one measure as a column and another as a row in the same chart.In the selected view type, from the Field pane, right-click the field and add it to column, row, or group as required.
Point the mouse at the save icon and click Save Ad Hoc View. You can also create a report while saving the view by clicking Save Ad Hoc View and Create Report.
Note: The created reports are saved only in the Shared and User folders. When the report is saved in the User folder, it is accessible to only that user who creates the report. If the report is saved in the Shared folder, the report is available to all roles. An administrator can restrict the content in the shared folder to specific roles by assigning the view to such roles.
To make the reports available for other users in the Shared folder, ensure that the Ad Hoc view on which the reports are created is also in Shared folder.
Enter the necessary information such as name and description, and click Save.
Note: Name of the Ad Hoc view should not exceed 94 characters and the special character Caret (^) is not supported.
A success message is displayed and the Ad Hoc view is created. Now you can create reports from the saved Ad Hoc view.
- To edit an Ad Hoc view, select the Ad Hoc view, click the
 icon, and select Edit Ad Hoc View.
 - To delete an Ad Hoc view, select the Ad Hoc view, click the icon, and select Delete Ad Hoc View.
Note: You can only delete the Ad Hoc views that are:- Created by you
- Available in the Shared folder
Note
- You can remove the missing items from the Ad Hoc view to continue using it even if there are dependencies with reports. The removed items no longer appear in the Data Source Selection panel.
- You can group time series data into Day of the Week.
- Search option is available for the fields in Ad Hoc designer.
- The ability to define basic Time Balance properties on measures, provides greater control of time series aggregate data. By default, all data are aggregated by summing time series values. New options let the user calculate aggregate time values by taking the first or last values of a time series. This benefits cases where opening and closing balance values (such as Inventory and Cash Balances) are measured. These options can change the totals to the sum of the numeric data for a period, as well as an average of the numeric values, the first numeric value entered for the period, and the last numeric value entered for the period.
- Created by you
Related content
© 2019 Serviceaide 1-650-206-8988 http://www.serviceaide.com info@serviceaide.com